
Product

Solutions
Resources
About Us
Use Cases
Contact Us

.png)
When working with data from different systems or sources, cleaning, matching, and linking data is crucial. These processes can be challenging, especially with large datasets or complex matching rules. That’s where Zingg open source entity resolution tool, comes in handy. When paired with Microsoft Fabric and enhanced by the data governance capabilities of Microsoft Purview, we have a powerful combination that simplifies the data integration tasks. Let’s explore how we can use these tools together to achieve seamless entity resolution and data governance.
Microsoft Purview is a unified data governance solution that helps us manage and discover data assets. By combining Zingg’s entity resolution capabilities with Purview, we can:
If you’re new to Fabric, the first step is creating an account. Don’t worry; it’s straightforward!
Head over to Fabric and sign up for a free trial. Once inside, take a quick tour of the interface. The Workspace tab is where you’ll organize your work. Let’s give it a name like “Zingg-Fabric”.
Tip: If you’re unsure about session cluster settings, choose a New Standard Session Let’s give it a name like “Zingg-Fabric.”

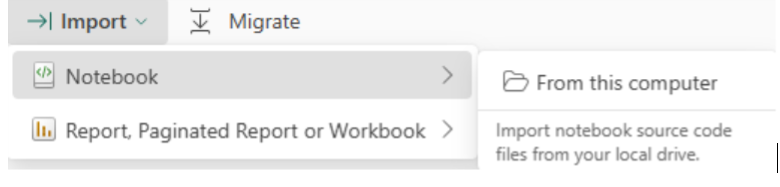
Open your newly created Zingg-Fabric Notebook or download notebook (ExampleNotebook.ipynb” ) from Zingg’s GitHub and upload the “ExampleNotebook.ipynb” to your workspace.
You need to go to the Environment tab and click on the New Environment button. You can name the new Environment "Zingg Environment".
.png)
To install the Zingg jar, follow the three steps below:
Visit Zingg releases, find the latest version of Zingg, and download the tar file and extract it.
.png)
Extract the jar file from the newly downloaded tar file, as shown in the image below.
.png)
Now you need to open the Environment, that you have created earlier. Then go to the custom library and upload the jar file there.
.png)
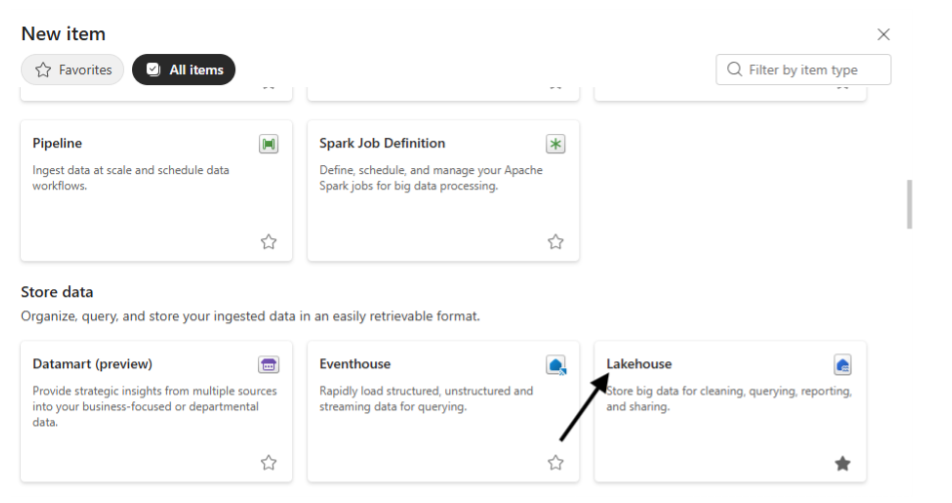
Now you need to go back to the Environment “Zingg Environment”, click the “new item” button and select Lakehouse inside of it.
Zingg supports multiple file formats like CSV, Parquet, or JSON. For this example, let’s use a CSV file. You now need to go inside the Lakehouse, click on “Get data,” and upload the CSV file.
.png)
You can also work with Delta Lake tables, which provide reliable, high-performance data storage and processing just by changing the input and output format in the notebook. (explained below, the remaining steps should remain the same.
If you don’t have data ready, you can download sample data from Zingg’s GitHub repository.
In this section we will Load all necessary libraries and dependencies required for Zingg to run.
spark.sparkContext.setCheckpointDir("Files").png)
This Sets a checkpoint directory in Microsoft Fabric’s Onelake for Spark to store intermediate computation data.
To ensure Zingg runs smoothly, you also need the Python package. Create a Fabric notebook in our workspace and type this:
pip install zingg.png)
This command fetches and installs the Zingg Python library and restarts the Python kernel so that you can use an updated package.
pip show zingg.png)
Displays details about the installed Zingg package like version, location, dependencies.
It’s a good idea to keep things neat, especially when you’re working with multiple datasets and training models. Zingg requires specific folders for its labelled and unlabelled training data. You can set up the directory paths in your notebook using the following command.
##you can change these to the locations of your choice
##these are the only two settings that need to change
zinggDir = "abfss://40640daf-1deb-4d7e-85d1-6f2888e2ec43@onelake.dfs.fabric.microsoft.com/c3bf3572-5ffb-4770-9de3-7c60cf5b91d8/Files"
modelId = "oss_9Dec" .png)
This cell is really a long command, if you’re unsure what this means, think of these folders as “buckets” where Zingg will store its work. Define some helper function which will be used later.
## Define constants
MARKED_DIR = zinggDir + "/" + modelId + "/trainingData/marked/"
UNMARKED_DIR = zinggDir + "/" + modelId + "/trainingData/unmarked/"


## Import necessary libraries
import pandas as pd
import numpy as np
from tabulate import tabulate
from ipywidgets import widgets, interact, GridspecLayout
import base64
import pyspark.sql.functions as fn


# Zingg libraries
from zingg.client import *
from zingg.pipes import *


# Function to count labeled pairs
def count_labeled_pairs(marked_pd):
    '''
    The purpose of this function is to count the labeled pairs in the marked folder.
    '''
    n_total = len(np.unique(marked_pd['z_cluster']))
    n_positive = len(np.unique(marked_pd[marked_pd['z_isMatch'] == 1]['z_cluster']))
    n_negative = len(np.unique(marked_pd[marked_pd['z_isMatch'] == 0]['z_cluster']))
    n_uncertain = len(np.unique(marked_pd[marked_pd['z_isMatch'] == 2]['z_cluster']))

    return n_positive, n_negative, n_uncertain, n_total

# Setup interactive widget
available_labels = {
    'No Match': 0,
    'Match': 1,
    'Uncertain': 2
}.png)
We initialize Zingg’s configuration by creating an Arguments object and setting the model directory.
#build the arguments for zingg
args = Arguments()
# Set the modelid and the zingg dir. You can use this as is
args.setModelId(modelId)
args.setZinggDir(zinggDir).png)
# Import pandas
import pandas as pd

# Define the schema (optional for validation)
schema = ["id", "fname", "lname", "stNo", "add1", "add2", "city", "areacode", "state", "dob", "ssn"]

# Load the CSV file
data = pd.read_csv("abfss://40640daf-1deb-4d7e-85d1-6f2888e2ec43@onelake.dfs.fabric.microsoft.com/c3bf3572-5ffb-4770-9de3-7c60cf5b91d8/Files/Test.csv",header=None)

# Ensure column names match the schema
data.columns = schema  # Adjust only if the file's column names differ

# Display the data
data.head().png)
You can Load a CSV file from your Fabric Lakehouse into a Pandas Data Frame with this command. You now need to change the ABFSS path and define its schema (column names), before you execute the cell.
To work with Tables, use this code:
.png)
schema = "rec_id string, fname string, lname string, stNo string, add1 string, add2 string, city string, areacode string, state string, dob string, ssn string"
inputPipe = CsvPipe("inputpipe", "abfss://40640daf-1deb-4d7e-85d1-6f2888e2ec43@onelake.dfs.fabric.microsoft.com/c3bf3572-5ffb-4770-9de3-7c60cf5b91d8/Files/Test.csv", schema)

args.setData(inputPipe).png)
Alternatively, if you are working with Delta tables, you can set up path as:
.png)
You can Configure the output. output can be a CSV, Parquet, Delta Tables, etc. The path for the output path will be ABFSS path of the directory where you want to keep the output files.
#setting outputpipe in 'args'
output_path = "abfss://40640daf-1deb-4d7e-85d1-6f2888e2ec43@onelake.dfs.fabric.microsoft.com/c3bf3572-5ffb-4770-9de3-7c60cf5b91d8/Files/Output"+modelId
outputPipe = CsvPipe("resultOutput", output_path)
args.setOutput(outputPipe).png)
Alternatively, if you are working with tables then
.png)
Here’s where Zingg starts to shine. It uses your rules to decide how to compare records. Let’s say you want to match people based on first name, last name, and city. Define these fields in your Notebook.
rec_id = FieldDefinition("rec_id", "string", MatchType.DONT_USE)
fname = FieldDefinition("fname", "string", MatchType.FUZZY)  # First Name
lname = FieldDefinition("lname", "string", MatchType.FUZZY)  # Last Name
stNo = FieldDefinition("stNo", "string", MatchType.FUZZY)    # Street Number
add1 = FieldDefinition("add1", "string", MatchType.FUZZY)    # Address Line 1
add2 = FieldDefinition("add2", "string", MatchType.FUZZY)    # Address Line 2
city = FieldDefinition("city", "string", MatchType.FUZZY)    # City
areacode = FieldDefinition("areacode", "string", MatchType.FUZZY)    # areacode
state = FieldDefinition("state", "string", MatchType.FUZZY)  # State
dob = FieldDefinition("dob", "string", MatchType.EXACT)      # Date of Birth (prefer exact match)
ssn = FieldDefinition("ssn", "string", MatchType.EXACT)      # SSN (should use exact match)

# Create the field definitions list
fieldDefs = [rec_id, fname, lname, stNo, add1, add2, city, areacode, state, dob, ssn]

# Set field definitions in args
args.setFieldDefinition(fieldDefs).png)
Field Definitions is defining which fields should appear in the output and whether and how they need to be used in matching.
Some match types are:
EXACT means records must match perfectly.
FUZZY allows for slight differences, like “Jon” and “John.”
You can get creative here depending on your data!
# The numPartitions define how data is split across the cluster.
# Please change the fllowing as per your data and cluster size by referring to the docs.

args.setNumPartitions(4)
args.setLabelDataSampleSize(0.4).png)
The Num Partitions define how data is split across the cluster. Please change this as per your data and cluster size by referring to the performance section of the Zingg docs. The LabelDataSampleSize is used for sampling in findTrainingData(in the next cell). It lets Zingg select pairs for labelling in a reasonable amount of time. If the findTrainingData phase is taking too much time, please reduce this by at least 1/10th of its previous value and try again.
We have completed setting up Zingg in the previous step. Zingg can’t magically know how to match your data, it needs your guidance!
So In this part, we will run the findTrainingData and Label phases. This involves generating candidate record pairs for training, presenting them for manual labelling, and saving the labelled data for use in model training. This step is essential for building a high-quality training dataset for entity resolution.
It generates candidate pairs, which are potential matches, for you to review:
options = ClientOptions([ClientOptions.PHASE,"findTrainingData"])

#Zingg execution for the given phase
zingg = ZinggWithSpark(args, options)
zingg.initAndExecute().png)
options = ClientOptions([ClientOptions.PHASE,"label"])

#Zingg execution for the given phase
zingg = ZinggWithSpark(args, options)
zingg.init().png)
This lets you prepare for user labelling and see if you have records for labelling.
Now retrieve unlabelled candidate record pairs and prepares them for manual labelling It also shows how many pairs we have accumulated for labelling.
# get candidate pairs
candidate_pairs_pd = getPandasDfFromDs(zingg.getUnmarkedRecords())

# if no candidate pairs, run job and wait
if candidate_pairs_pd.shape[0] == 0:
  print('No unlabeled candidate pairs found.  Run findTraining job ...')

else:
    # get list of pairs (as identified by z_cluster) to label
    z_clusters = list(np.unique(candidate_pairs_pd['z_cluster']))

    # print candidate pair stats
print('{0} candidate pairs found for labeling'.format(len(z_clusters))).png)
In this step you start labelling to make Zingg learn how you want to match our data.
After executing this cell, you should see several pairs of data for manual matching. Review these pairs in Fabric and manually label them as matches or non-matches or uncertain. Think of it as teaching Zingg what’s right and wrong.
# Label Training Set
# define variable to avoid duplicate saves
ready_for_save = False
# user-friendly labels and corresponding zingg numerical value
# (the order in the dictionary affects how displayed below)
LABELS = {
'Uncertain':2,
'Match':1,
'No Match':0
}
# GET CANDIDATE PAIRS
n_pairs = int(candidate_pairs_pd.shape[0]/2)
# DEFINE IPYWIDGET DISPLAY
# ========================================================
display_pd = candidate_pairs_pd.drop(
labels=[
'z_zid', 'z_prediction', 'z_score', 'z_isMatch', 'z_zsource'
],
axis=1)
# define header to be used with each displayed pair
html_prefix = "<p><span style='font-family:Courier New,Courier,monospace'>"
html_suffix = "</p></span>"
header = widgets.HTML(value=f"{html_prefix}<b>" + "<br />".join([str(i)+" " for i in display_pd.columns.to_list()]) + f"</b>{html_suffix}")
# initialize display
vContainers = []
vContainers.append(widgets.HTML(value=f'<h2>Indicate if each of the {n_pairs} record pairs is a match or not</h2></p>'))
# for each set of pairs
for n in range(n_pairs):
# get candidate records
candidate_left = display_pd.loc[2*n].to_list()
candidate_right = display_pd.loc[(2*n)+1].to_list()
# define grid to hold values
html = ''
for i in range(display_pd.shape[1]):
# get column name
column_name = display_pd.columns[i]
# if field is image
if column_name == 'image_path':
# define row header
html += '<tr>'
html += '<td><b>image</b></td>'
# read left image to encoded string
l_endcode = ''
if candidate_left[i] != '':
with open(candidate_left[i], "rb") as l_file:
l_encode = base64.b64encode( l_file.read() ).decode()
# read right image to encoded string
r_encode = ''
if candidate_right[i] != '':
with open(candidate_right[i], "rb") as r_file:
r_encode = base64.b64encode( r_file.read() ).decode()
# present images
html += f'<td><img src="data:image/png;base64,{l_encode}"></td>'
html += f'<td><img src="data:image/png;base64,{r_encode}"></td>'
html += '</tr>'
elif column_name != 'image_path': # display text values
if column_name == 'z_cluster': z_cluster = candidate_left[i]
html += '<tr>'
html += f'<td style="width:10%"><b>{column_name}</b></td>'
html += f'<td style="width:45%">{str(candidate_left[i])}</td>'
html += f'<td style="width:45%">{str(candidate_right[i])}</td>'
html += '</tr>'
# insert data table
table = widgets.HTML(value=f'<table data-title="{z_cluster}" style="width:100%;border-collapse:collapse" border="1">'+html+'</table>')
z_cluster = None
# assign label options to pair
label = widgets.ToggleButtons(
options=LABELS.keys(),
button_style='info'
)
# define blank line between displayed pair and next
blankLine=widgets.HTML(value='<br>')
# append pair, label and blank line to widget structure
vContainers.append(widgets.VBox(children=[table, label, blankLine]))
display(widgets.VBox(children=vContainers))
# ========================================================
# mark flag to allow save
ready_for_save = True
.png)
.png)
.png)
You must carefully complete the step, as how well Zingg will perform later will be based on this step.
.png)
Save your labels by executing the below code
if not ready_for_save:
  print('No labels have been assigned. Run the previous cell to create candidate pairs and assign labels to them before re-running this cell.')

else:

  # ASSIGN LABEL VALUE TO CANDIDATE PAIRS IN DATAFRAME
  # ========================================================
  # for each pair in displayed widget
  for pair in vContainers[1:]:

    # get pair and assigned label
    html_content = pair.children[1].get_interact_value() # the displayed pair as html
    user_assigned_label = pair.children[1].get_interact_value() # the assigned label

    # extract candidate pair id from html pair content
    start = pair.children[0].value.find('data-title="')
    if start > 0:
      start += len('data-title="')
      end = pair.children[0].value.find('"', start+2)
    pair_id = pair.children[0].value[start:end]


    # assign label to candidate pair entry in dataframe
    candidate_pairs_pd.loc[candidate_pairs_pd['z_cluster']==pair_id, 'z_isMatch'] = LABELS.get(user_assigned_label)

  # SAVE LABELED DATA TO ZINGG FOLDER
  # ========================================================
  # make target directory if needed
  notebookutils.fs.mkdirs(MARKED_DIR)

  # save label assignments
  zingg.writeLabelledOutputFromPandas(candidate_pairs_pd,args)

  # count labels accumulated
  marked_pd_df = getPandasDfFromDs(zingg.getMarkedRecords())
  n_pos, n_neg, n_uncer, n_tot = count_labeled_pairs(marked_pd_df)
  print(f'Out of total {n_tot} pairs,')
  print(f'You have accumulated {n_pos} pairs labeled as positive matches.')
  print(f'You have accumulated {n_neg} pairs labeled as not matches.')
  print(f'You have accumulated {n_uncer} pairs labeled as uncertain.')
  print("If you need more pairs to label, re-run the cell for 'findTrainingData'")
  # ========================================================

  # save completed
ready_for_save = False.png)
After saving the labels, perform few more iterations of findTrainingData and Labeling. (steps 1 to 5). Recommendation: 40+ matches and 40+ non-matches for data size of ~100k, though more will be better
We have completed setting up Zingg and labeled the training data in the previous steps. In this part, we will run the generateDocs phase.
This phase processes the labelled data to create the readable documentation about the training data, including those marked as matches, as well as non-matches. It helps user to cross verify their labelling. This step is optional so you can directly jump to next step.
Zingg creates detailed documentation to help you understand how it makes decisions. Generate and view the docs with:
options = ClientOptions([ClientOptions.PHASE,"generateDocs"])
#Zingg execution for the given phase
zingg = ZinggWithSpark(args, options)
zingg.initAndExecute()
Use to below code to check the the number of matches and non-matches you have performed, in the label phase.
displayHTML(open(DOCS_DIR+"model.html", 'r').read())

We have completed setting up Zingg, labelled the training data, and generated the required documents in the previous steps. In this part, we will run the Train and Match phases.
This involves training the entity resolution model using the labelled data and then applying the trained model to match records in your dataset. This step is crucial for identifying and matching similar entities across your data sources.
After labelling, it’s time to let Zingg do the heavy lifting. Training adjusts its algorithms to your specific dataset. Sit back and relax, Zingg will process the data and build your model.
options = ClientOptions([ClientOptions.PHASE,"trainMatch"])

#Zingg execution for the given phase
zingg = ZinggWithSpark(args, options)
zingg.initAndExecute().png)
Once the model is ready, you can run predictions to see which records are likely matches. The output will be created in the specified path.
colNames = ["z_minScore", "z_maxScore", "z_cluster", "id", "fname", "lname", "stNo", "add1", "add2", "city","areacode", "state", "dob", "ssn"]
outputDF = spark.read.csv(output_path)
outputDF = outputDF.toDF(*colNames)
display(outputDF).png)
z_cluster : Unique ID assigned by Zingg, all records with the same cluster are matching or duplicated. This helps to group the matching records together.
z_minScore: The Z_MINSCORE column is an indicator for the least that record matched to any other record in the cluster.
z_maxScore: The Z_MAXSCORE is an indicator for the most that record matched to another record in the cluster.
Congratulation! Finally, you’ve just implemented your first entity resolution pipeline on Microsoft Fabric with Zingg!
By combining Zingg’s entity resolution capabilities with Microsoft Fabric’s analytics power and Purview’s governance features, you can handle even the most complex data challenges. This integration not only simplifies our workflows but also ensures that our data is clean, compliant, and ready for analysis.
When you get more comfortable, you will love to explore Zingg’s advanced features like blocking strategies and custom match algorithms.

