
Product

Solutions
Resources
About Us
Use Cases
Contact Us

.png)
GitHub only keeps 14 days of traffic data. Views, clones, referrers — after two weeks it's gone. Was there a spike in clones last month — and if so, where did it come from? Are more people finding us through Google or through GitHub search? Which pages on our docs are actually being read?
We were flying blind on all of this. We kept meaning to do something about this and kept not doing it.
A few weeks ago we finally sat down and wrote some scripts with the help of Claude. The result is zingg-stats. We're open sourcing it today because we suspect most open source maintainers have the same problem, and there's no reason everyone should have to build this from scratch or vibe code it.
A cron job runs three Python scripts every morning. Each one does one thing.
zingg_daily_stats.py hits the GitHub traffic API and appends any new rows to CSV files sitting in a separate repo (zinggAI/github_traffic). Page views, clones, top referrers, top paths — one row per day, deduplicated so it's safe to run more than once. Files rotate monthly. This is mainly just solving the 14-day problem: as long as the script runs every couple of weeks, we never lose data.
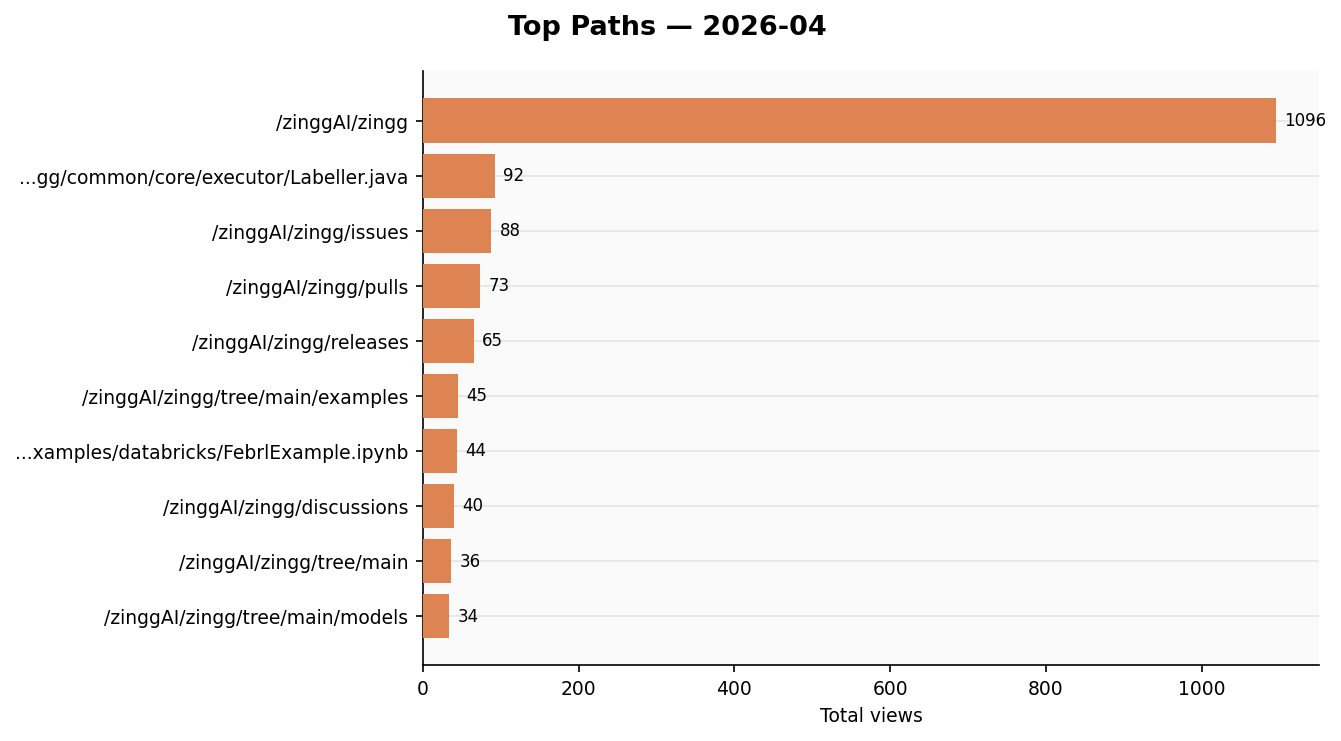
visualize.py reads those CSVs and generates charts — views and clones as bar charts, stars and forks over time, top referrers and paths as horizontal bars. Uploads them to Slack. You can ask it for the last N months:
python visualize.py --config ~/.zingg/config.py --last 3
ga_daily_report.py
By around 9:15am there are four messages in #repo-stats:
Takes about 15 seconds to read. Before this we basically never looked at any of it.
.png)
Two GitHub PATs. The token that reads traffic from zingg-ai/zingg is separate from the one that writes CSVs to zinggAI/github_traffic. If the storage token were ever leaked it can't read private traffic data.
CSVs in a git repo. We thought about a database. A git repo is simpler — it's already versioned and backed up, you can open files in the browser, and =IMPORTDATA() in Google Sheets pulls them in directly. No infrastructure to maintain.
config.py lives outside any repo. All credentials are in one file that never gets committed. Scripts take a --config /path/to/config.py argument so the code itself has no secrets in it.
Plain Slack bot token. We looked at token rotation. The added complexity wasn't worth it for an internal bot.
Full instructions are in the README. Short version:
git clone https://github.com/zinggAI/zingg-stats
cd zingg-stats
python3 -m venv venv && source venv/bin/activate
pip install requests pandas matplotlib google-analytics-data google-auth

# fill in your credentials in config.py
python zingg_daily_stats.py --config ~/.zingg/config.py
You'll need a GitHub PAT scoped to the org, a Slack bot token with chat:write and files:write, a Google service account for GA4, and a Google Custom Search API key for mentions.
The README walks through each one.
The scripts are written to be easy to adapt. The repo names, Slack channel, and search keywords are all in config.py. If your project has a different name or lives in a different org, it's a few lines to change.
We built this for Zingg but tried to keep it generic enough to be useful for any project with a GitHub repo, a GA property, and a Slack workspace.
Things we'd like to add at some point: contributor metrics (PR velocity, new contributors), issue health, PyPI download counts, and some kind of alerting when something looks unusual. If you use this for your own project and add something useful, PRs are welcome.
Zingg is an open source entity resolution library

